Note
Go to the end to download the full example code.
3D plots
Plot the 3D geometry and results
Download Input files
Setting up
Standard Loading of input, Parsing and Initializing RoxiePlotOutputs object
from roxieapi.output.plots import RoxiePlotOutputs

plots = RoxiePlotOutputs(
    "../input_files/dipole_3d.post.xml", "../input_files/dipole_3d.data"
)
Extracting plot information
Load 3D plot and get plot information
parser = plots.output

p3d = parser.get_3d_plot(1)  # We load Plot Number 1 (defined in datafile)
assert p3d is not None
Create the plot
figure = plots.plots3d.plot_3d(p3d)
figure.show()
Changing the dataset to plot
print("Available Datasets:")
for id, pl in enumerate(p3d.coilPlots):
    print(f"Index {id} with label {pl.label}")
# Set the new prefered dataset:
p3d.active = p3d.coilPlots[2]

# Print with new dataset
figure2 = plots.plots3d.plot_3d(p3d)
figure2.show()
Available Datasets:
Index 0 with label Coil
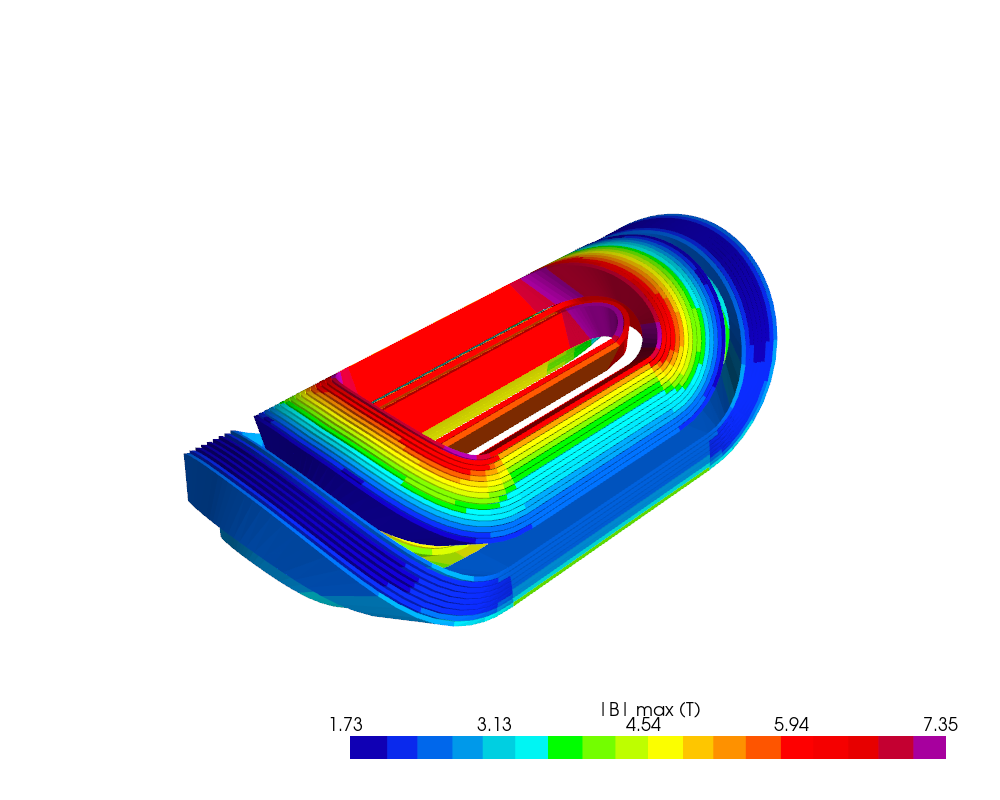
Index 1 with label |B| max (T)
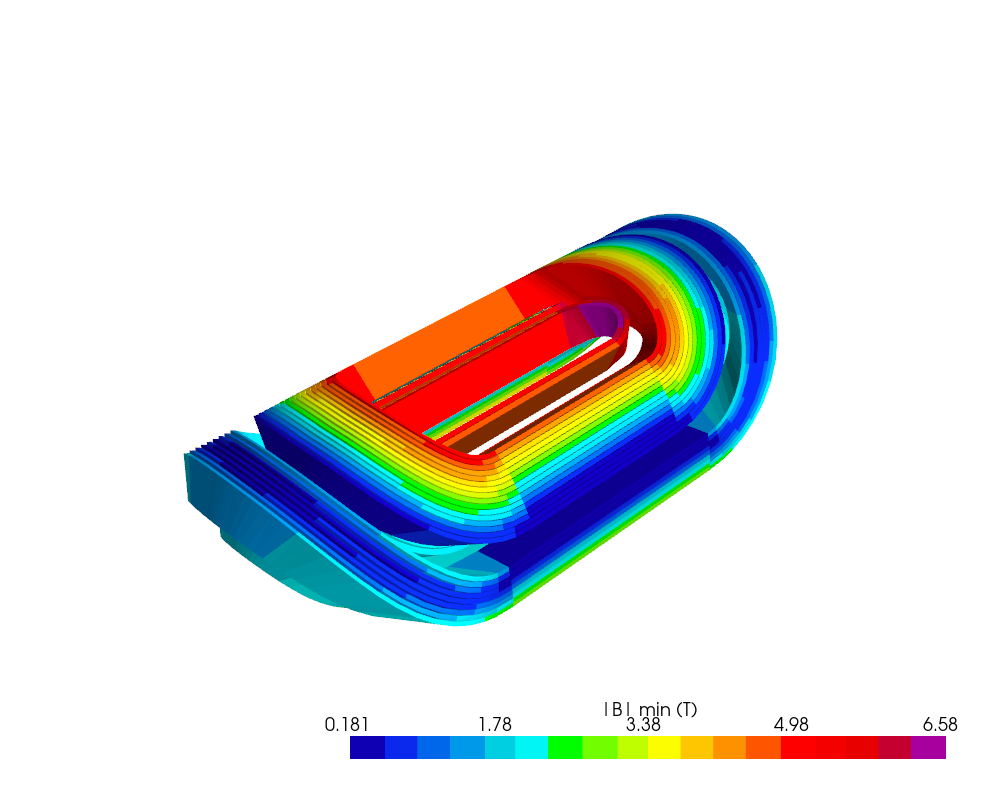
Index 2 with label |B| min (T)
Total running time of the script: (0 minutes 3.451 seconds)