Note
Go to the end to download the full example code.
2D Forces plots
Use the output of a harmonic coil and show the Field quality
Download Input files
Setting up
Standard Loading of input, Parsing and Initializing RoxiePlotOutputs object
from roxieapi.output.plots import RoxiePlotOutputs

plots = RoxiePlotOutputs(
    "../input_files/dipole_2d.post.xml", "../input_files/dipole_2d.data"
)
Plotting the Roxie standard Forces plot
Show all forces as Graph, with y=Force, and x=Conductor number
parser = plots.output
forces = parser.get_conductor_forces()
if forces is not None:
    fig = plots.graphs.plot_forces(forces)
    fig
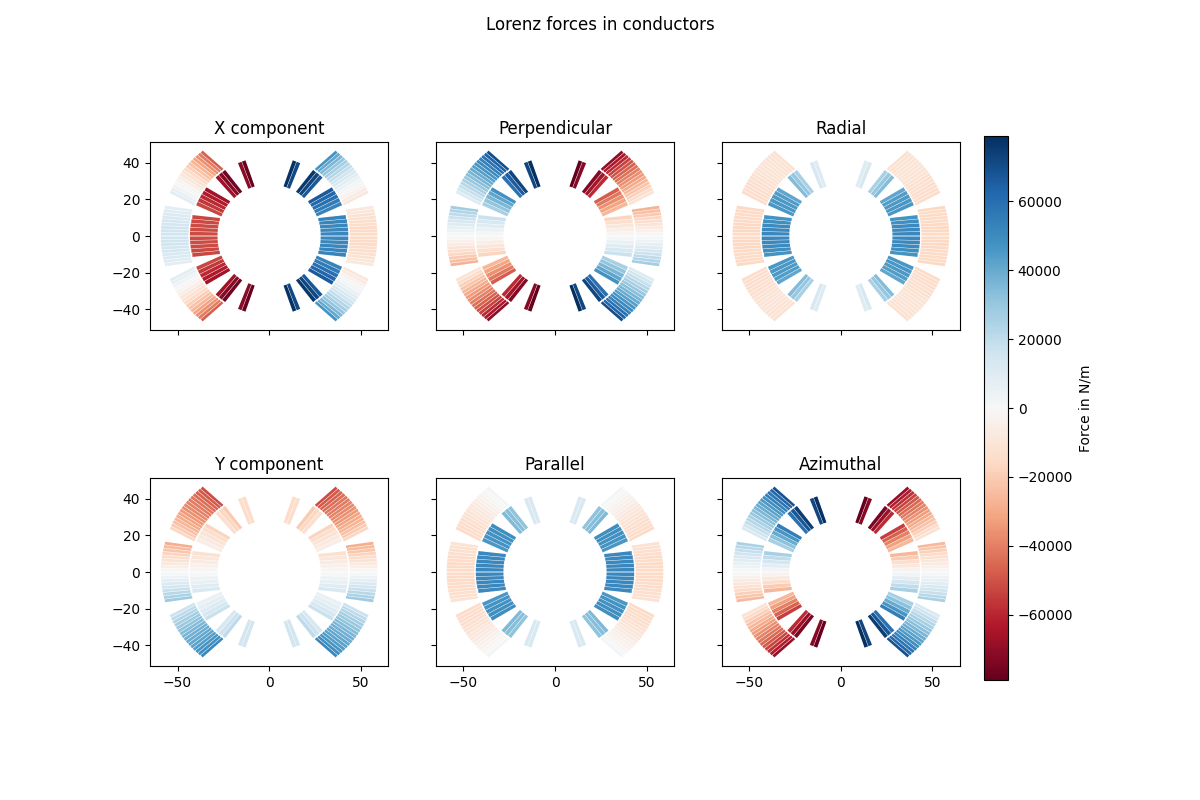
Plotting as 2D crossection plot
Same information, but for each force plot a separate crosssection plot
plots.plots2d.plot_conductor_forces()
<Figure size 1200x800 with 7 Axes>
Show as table
Most output data is stored in Pandas Dataframes, so they can be used for tabular output (to display or files)
forces
Total running time of the script: (0 minutes 0.715 seconds)